How to Choose Colors for Data Visualization
Color theory fundamentals and 4 essential tools for better palettes
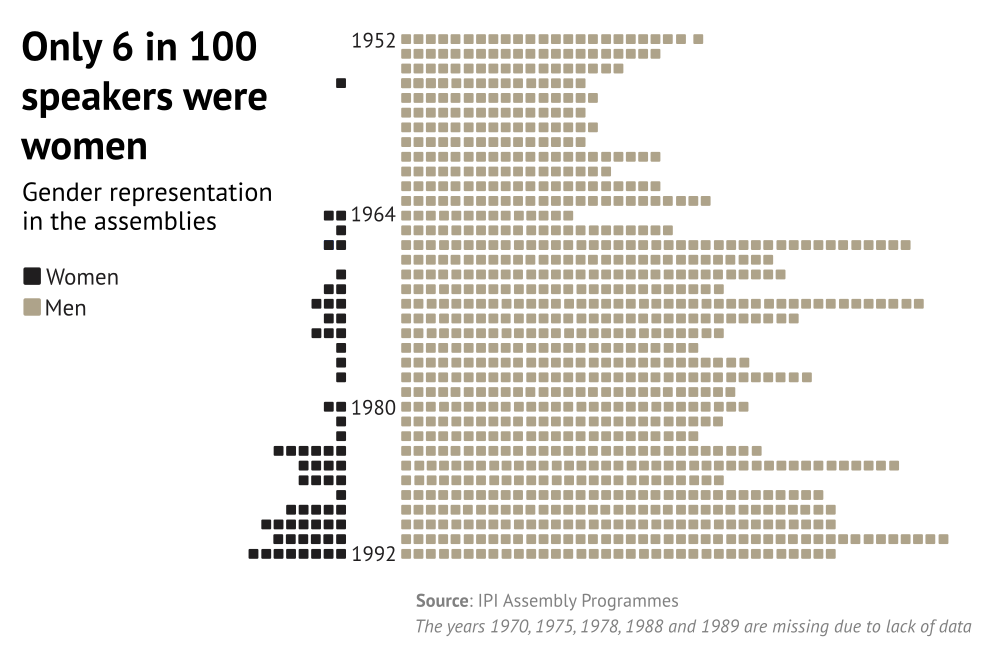
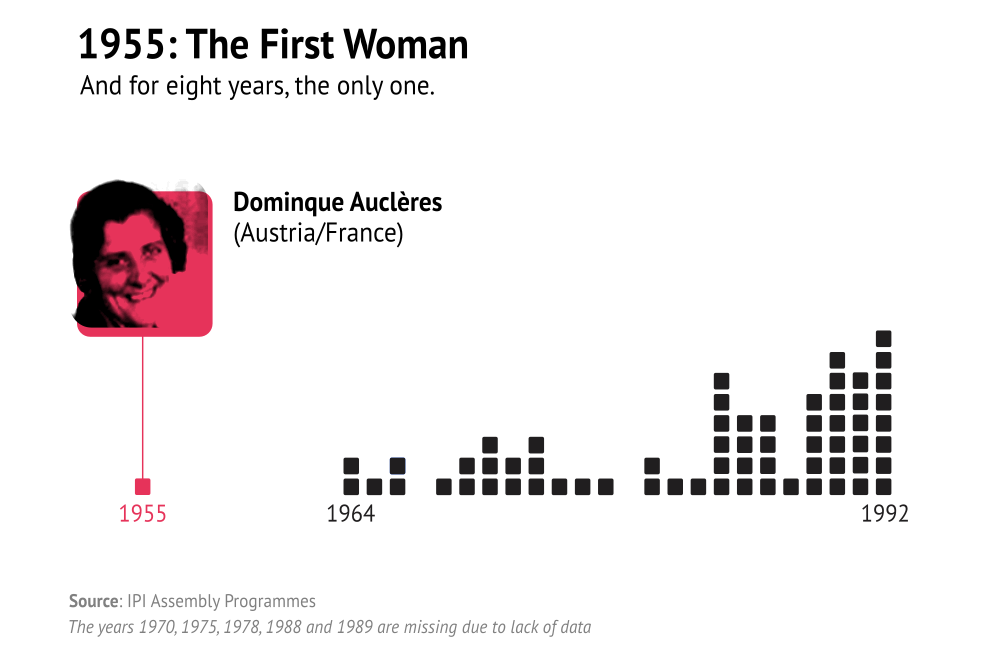
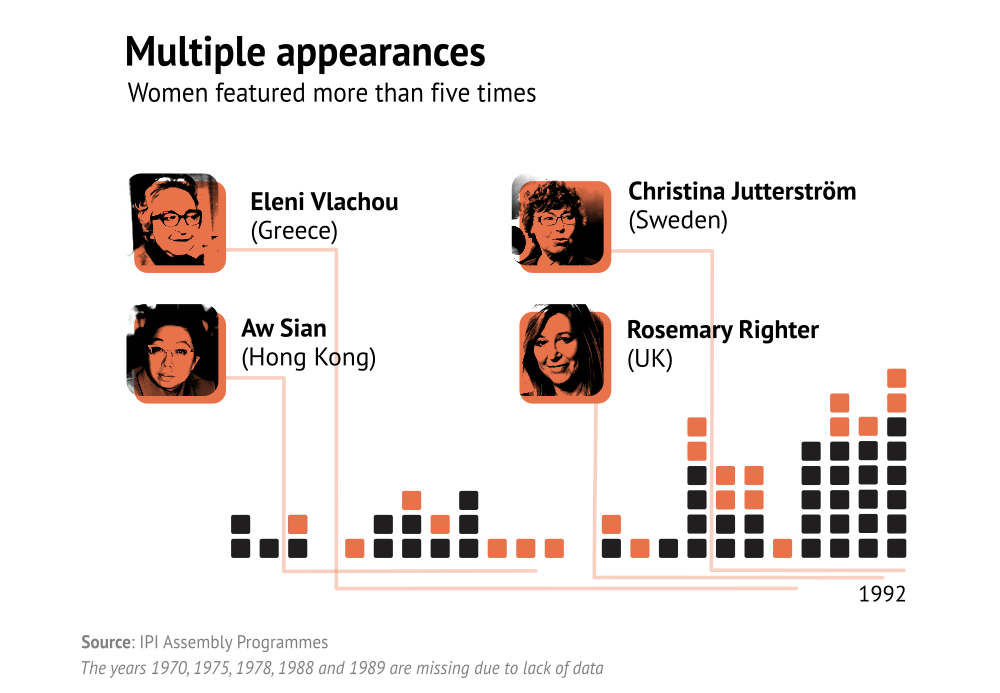
Recently, I had the pleasure of creating a data visualisation again, this time for this piece as part of the International Press Institute's archive exposition. I ended up making three visualisations I'm quite happy with:
One of my biggest challenges when creating a data visualisation is choosing a colour palette. In my defense: colour and the interactions between colours form a vast field of study. Not one book has been written on the subject. To understand colour, we need to develop an intuition for our own visual perception. It's a lifetime of learning.
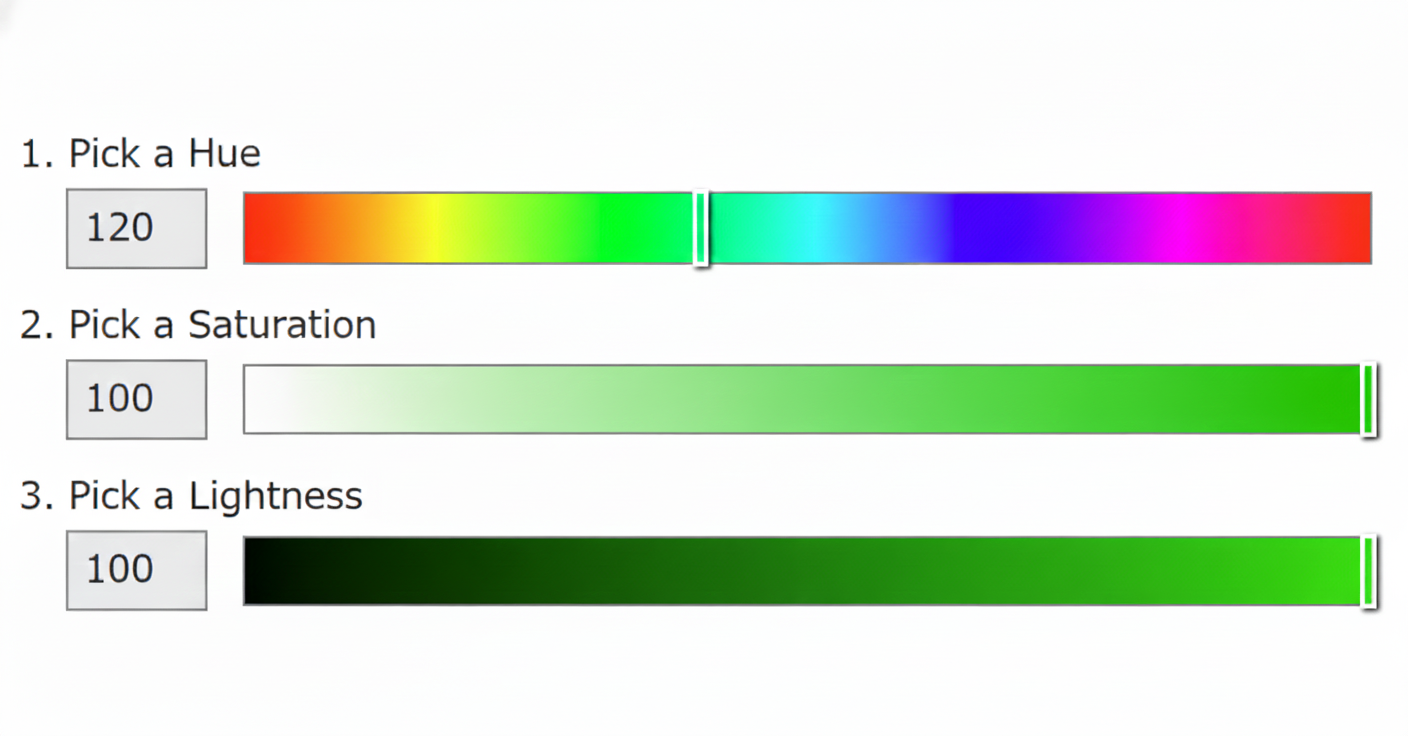
Recently, this article by RJ Andrews called Colour Engineering really rocked my world. It gave me a lifeline by showing a quantifiable system behind colour choices, based on three properties of colour: hue, saturation and lightness also called HSL.
The biggest takeaway was that lightness is the most important factor for distinguishing colours (even more than hue), because our eyes are best trained to differentiate light from dark. There's more to it, of course, but I loved this insight. Leveraging it helps me both harmonise colours across a palette and distinguish them effectively.
I won't repeat what the article explains so well, I highly recommend giving it a read (it's short, with pictures!). Instead, I'd like to expand on that information with... drumroll... tools!
1. Color Analyzer
I blatantly copied the idea from the article and turned it into something interactive. You can now play with it and make your own colour palettes.
2. Contrast Checker
Even though I now rely less on Coolors for generating palettes, I still love and use their contrast checker. If you create a palette and plan to put text over a background, it's incredibly useful for checking readability. Hint: it's all in the lightness too!
3. Accessible Palette
Ready to dive deeper into colour theory? HSL is just one way to break colour down. In this blogpost, Eugene Fedorenko explains why he dropped HSL in favour of LAB, and how he built an app for creating colour systems with consistent lightness and contrast. Try Accessible Palette yourself.
4. Color Palette Pro
This tool is a result of Ryan Feigenbaum's frustration with existing color palette generators: "Mine just sucks less." For those who really know what they're doing, or just enjoy retro interfaces for looking at pretty colours and pressing buttons, check out Color Palette Pro.
Mentorship
Would you like some help on the way to data visualization mastery? Join our mentorship program!
Not sure it's right for you? Let's chat!