Data Frosch helps journalists and other (aspiring) data specialists navigate the world of data with the confidence of a leaping frog.
Learn how to collect, analyze, and communicate data effectively! Become better at using spreadsheets, polish those programming skills 🐍 and perfect your data visualisation techniques.
Whether you're a journalist enriching stories with data, an analyst, designer, or marketer creating visualizations, you will find hands-on, practical training to make your data work for you 💪🐸.
We will help you learn to find and tell stories with data. Together we will pick a project to work on for 8 weeks. In this time, we will build the skills of your choice—be it basic data analysis, programming, or data communication. By working towards an actual story from start to finish, you will learn to use these skills to work seamlessly with any other aspects of research and reporting.
Regular online meetings to review your progress, tackle challenges, and refine your work. Daily support via Discord.
Personalized 8-week program covering topics chosen to accelerate your growth as a data storyteller.
Join a curated Discord community for extra resources, peer feedback, and networking with other data professionals.
February 18, 2026
Why percentages mislead, and what journalists can do about it
Percentages are everywhere in the news, but they often mislead. Jonathan Stoneman explores why '% more likely' is bad journalese, how percentages don't behave like normal numbers, and why context is always key in data reporting.

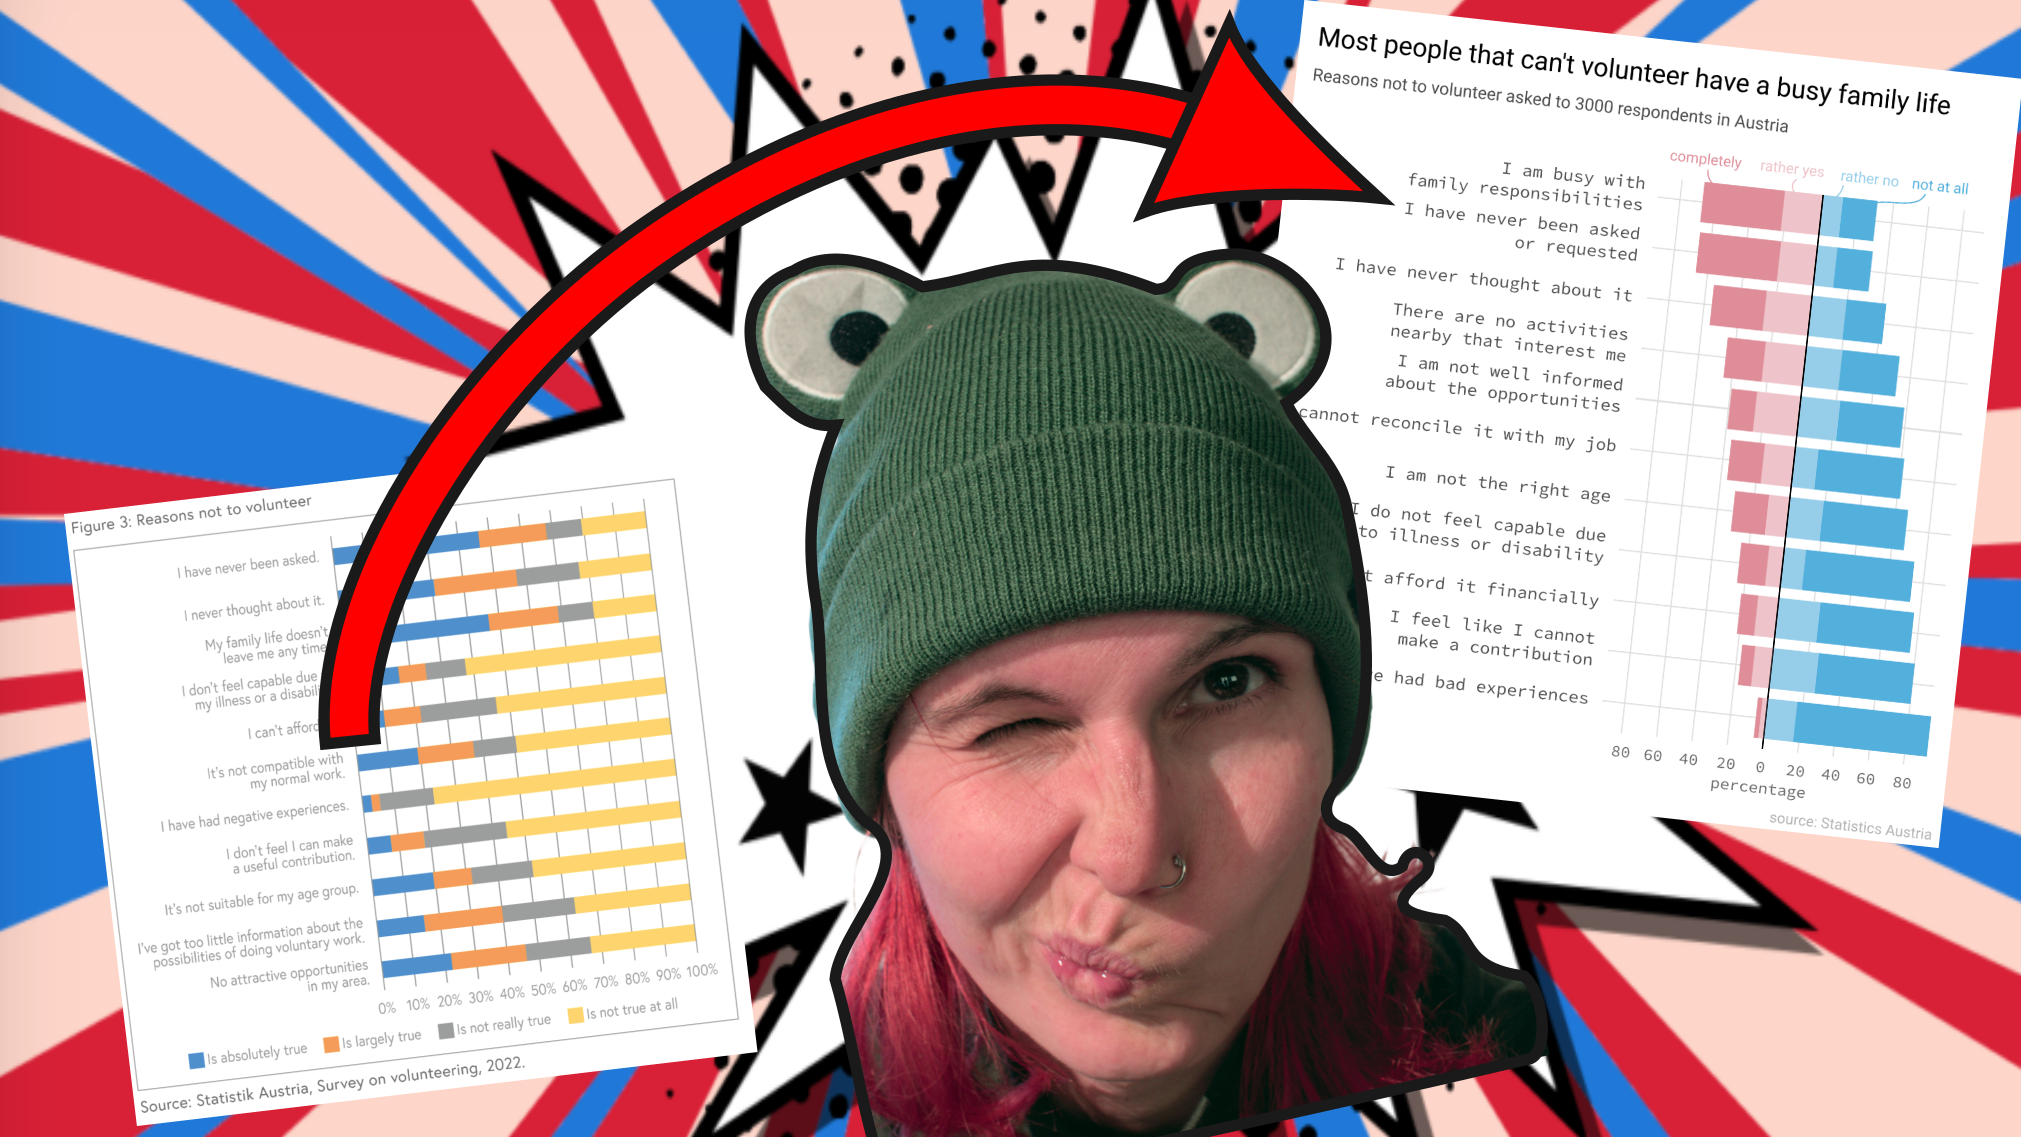
Not all data visualisations communicate clearly. In this video I am transforming a confusing chart into a clear visualization using open source tools.

The form we give our data isn’t neutral. It shapes what others see—or overlook. Learn how to match your data to its perfect outfit!